In 2026, affording a home has very little to do with the biggest number a bank is willing to stamp on an approval letter, and everything to do with whether that payment fits your life without squeezing it dry. The housing market may have evolved, lending limits may have stretched, and calculators may flash eye-watering purchase prices, but the core question hasn’t changed: can you own this home comfortably, consistently, and without financial stress?
Too many buyers confuse qualification with affordability. They’re not the same thing, and mistaking one for the other is how people end up house poor.
The Difference Between Lender Approval and Real-Life Affordability
Lenders approve mortgages based on formulas, ratios, and risk tolerance, not on how you actually live. If the numbers technically work on paper, a lender may green-light a payment that leaves little room for saving, investing, travel, emergencies, or even enjoying your income.

Real-life affordability is stricter. It asks a harder question: After paying for the house, do you still have breathing room? Can you absorb rising property taxes, higher insurance premiums, or a temporary income dip without panic? Approval answers “Can you pay?” Affordability answers “Can you live?”
Why Comfort, Cash Flow, and Lifestyle Matter More Than Maximum Approval
A mortgage doesn’t exist in isolation. It competes with everything else your money needs to do, build an emergency fund, fund retirement, cover childcare, support a social life, or allow flexibility if your goals change.
When housing costs dominate your monthly cash flow, even a “successful” purchase can quietly sabotage long-term wealth. Comfort matters because sustainable finances outperform stretched ones every time. Cash flow matters because liquidity gives you options. Lifestyle matters because a home that forces constant trade-offs rarely feels like a win.
The Guiding Principle: Bank Limits vs. Stress-Free Budgeting
Here’s the rule that cuts through the noise:
You can realistically afford a home in 2026 when the full monthly cost of owning it fits comfortably inside your income, debt, and lifestyle, even if the bank would approve you for more.

Your true affordability is the lower of two numbers:
- What a lender will allow based on their limits
- What keeps your budget calm, flexible, and resilient
Choose the second number. Every time.
Because the goal isn’t just to buy a home, it’s to own one without financial regret.
Core Rules Of Thumb For 2026
While the housing market, interest rates, and loan limits continue to evolve, the core math behind affordability in 2026 hasn’t changed much. What has changed is how aggressively lenders are willing to stretch those numbers. That’s why rules of thumb still matter, not as rigid laws, but as guardrails that keep buyers from drifting into financial stress.
At the center of those guardrails is a modern take on the classic 28/36 rule.
The Modern 28/36 Rule Explained
The traditional 28/36 rule was designed decades ago, but it remains surprisingly relevant in 2026, with one important tweak: many financially stable buyers now aim slightly below the original limits.
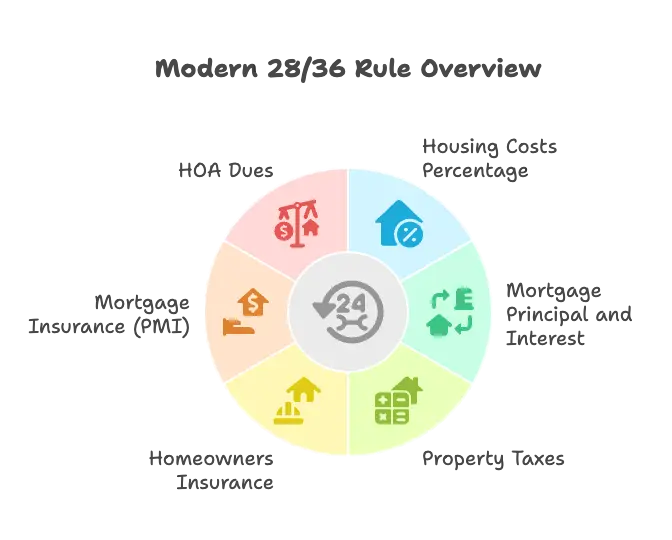
Housing costs as a percentage of gross income
As a baseline, aim to keep your total monthly housing costs at roughly 25–28% of your gross monthly income. This includes:
- Mortgage principal and interest
- Property taxes
- Homeowners insurance
- Mortgage insurance (PMI), if applicable
- HOA dues, if applicable
Staying in this range helps ensure your home doesn’t dominate your budget, even when costs rise over time.
Total debt limits, and why lenders may allow more than you should accept
The second half of the rule focuses on all monthly debt. A conservative target is keeping total debt payments, including housing, car loans, student loans, credit cards, and personal loans, at 36–40% of gross income.
In 2026, many lenders are willing to approve borrowers well beyond this range, sometimes into the mid-40s or even around 50% for strong applicants. That doesn’t mean it’s wise. Lender limits are designed to minimize default risk, not maximize your quality of life.
Front-End vs. Back-End DTI
Debt-to-income (DTI) ratios are how lenders, and smart buyers, measure affordability. Understanding the difference is critical.
What front-end DTI measures
Front-end DTI looks only at housing costs. It compares your total monthly housing payment to your gross monthly income. This is where the 25–28% guideline comes from, and it’s the clearest signal of whether a home payment feels manageable month to month.
What back-end DTI includes
Back-end DTI includes everything: housing plus all other recurring debts. This ratio reveals how much of your income is already spoken for before groceries, savings, and lifestyle expenses enter the picture.
Why conservative ratios reduce the risk of being house-poor
When housing and debt consume too much of your income, even small disruptions, like a tax increase or a surprise repair, can cause outsized stress. Conservative DTIs leave room for real life, not just spreadsheet math.
Why Playing Below the Limits Matters
Buying below your maximum approval isn’t timid, it’s strategic.
 Cash flow flexibility
Lower fixed payments mean more monthly breathing room. That flexibility lets you save, invest, travel, and handle surprises without leaning on credit cards or stress.
Protection against income changes
Careers shift, bonuses disappear, and businesses have slow periods. A conservative housing payment gives you margin when income isn’t perfectly predictable.
Long-term financial stability
Over time, homeowners who buy within conservative limits build wealth faster. They’re better positioned to handle rising costs, refinance strategically, and pursue future goals without feeling trapped by their mortgage.
In 2026, affordability isn’t about how much house you can buy, it’s about how much house still lets your financial life move forward.
How Lenders Decide What You “Qualify” For
When a lender tells you what you “qualify” for, they’re not making a lifestyle recommendation, they’re making a risk assessment. Mortgage approvals in 2026 are built around formulas designed to answer one question only: How likely are you to repay this loan? Understanding how those decisions are made helps explain why approval numbers often feel disconnected from real-world affordability.
The Role of Debt-to-Income Ratios in Approval
Debt-to-income (DTI) ratios sit at the center of almost every mortgage decision. In 2026, most conventional mortgage programs are comfortable approving total (back-end) DTIs in the low-to-mid 40% range, with some approvals stretching toward 50% under automated underwriting systems. FHA and certain other programs may also tolerate higher ratios in specific cases.
From a lender’s perspective, these caps reflect historical default data, not day-to-day comfort. As long as the loan fits within program guidelines, the lender may approve a payment that leaves very little discretionary income.
How underwriting strength affects flexibility
DTI limits aren’t fixed for every borrower. Strong compensating factors, such as excellent credit, a large down payment, or significant cash reserves, can allow lenders to stretch closer to their maximum ratios. Weaker profiles, on the other hand, often trigger tighter limits or require additional documentation.
Credit Score, Down Payment, And Reserves
DTI alone doesn’t tell the full story. Lenders weigh multiple factors together to decide how far they’re willing to go.
How credit profile influences approval size
A higher credit score signals a history of reliable repayment. In 2026, borrowers with strong credit profiles are more likely to receive approvals at higher loan amounts, better interest rates, and more flexible DTI treatment. Lower scores don’t automatically disqualify buyers, but they often result in smaller approvals, higher rates, or added insurance costs.
Why stronger borrowers are allowed higher DTIs
From the lender’s view, a borrower with excellent credit and cash reserves poses less risk, even with a higher monthly payment. That’s why well-qualified applicants are sometimes approved for loans that would be uncomfortable or risky for someone with a thinner or weaker profile.
Conforming Loan Limits And Market Reality
Beyond personal finances, there’s another ceiling that affects what you can qualify for: loan limits.
What conforming loan limits are
Conforming loans are mortgages that meet the size and underwriting standards set by Fannie Mae and Freddie Mac. Each year, the Federal Housing Finance Agency (FHFA) updates the maximum loan amounts these agencies will back. Loans within these limits generally come with easier approval standards and lower interest rates.
How rising home prices affect borrowing power
As home prices have climbed, conforming loan limits have risen as well, expanding the range of homes buyers can finance with conventional loans. In higher-cost areas, these limits are significantly higher than the national baseline, reflecting local market realities.
When borrowers are pushed into jumbo loans
Once a home price exceeds conforming limits, buyers must turn to jumbo loans. These loans aren’t backed by Fannie Mae or Freddie Mac, and they typically come with stricter underwriting, higher credit score requirements, larger down payments, and greater reserve expectations. For many buyers, this shift alone can redefine what’s realistically affordable, even if the monthly payment appears manageable on paper.
The key takeaway: qualification is shaped by lender risk rules, market limits, and borrower strength, not by what makes financial sense for your life.
Step-By-Step: Calculating Your Own Affordability
Once you understand lender rules and general guidelines, the next step is translating them into a number that actually works for you. This framework helps you calculate a realistic 2026 home price by starting with your income, layering in debt, and pressure-testing the result before you commit.

Step 1: Add Up Stable Gross Income
What income counts
Start with income that is predictable and verifiable. This typically includes base salary, consistent overtime, reliable bonuses, commissions with a track record, and other recurring income a lender would recognize. Irregular side income or brand-new revenue streams should be treated cautiously, even if they feel reliable now.
Monthly conversion
Once you’ve totaled your annual gross income, divide by 12 to get a monthly figure. This is the number used in DTI calculations and affordability formulas. Using gross (pre-tax) income keeps your estimates aligned with how lenders and calculators operate.
Step 2: Estimate a Safe Housing Budget
Applying the 25–28% guideline
Multiply your gross monthly income by 0.25 to 0.28 to arrive at a conservative housing payment target. This range reflects a payment level that’s more likely to feel comfortable over time, not just affordable at closing.
What costs must be included in housing
Your housing budget should include the entire monthly cost of ownership, not just the mortgage:
- Principal and interest
- Property taxes
- Homeowners insurance
- Mortgage insurance (PMI), if applicable
- HOA dues, if applicable
Ignoring any of these can lead to a payment that looks fine on paper but strains cash flow in reality.
Step 3: Tally All Other Monthly Debts
Types of debts to include
List the minimum required payments for all recurring debts, including:
- Auto loans
- Student loans
- Credit cards
- Personal loans
- Any other installment or revolving obligations
These payments compete directly with your housing budget.
Keeping total DTI conservative
Add your estimated housing payment to these debts and compare the total to your gross monthly income. Aiming to stay below 36–40% total DTI provides a margin of safety, even if lenders would approve a higher ratio.
Step 4: Use Home Affordability Calculators
Inputs readers should prepare
To get useful results, have the following ready:
- Gross monthly income
- Monthly debt payments
- Down payment amount
- Estimated interest rate
- Property tax and insurance assumptions
Accurate inputs matter more than the specific calculator you choose.
What outputs to focus on
Pay attention to:
- Estimated monthly payment
- Total housing cost breakdown
- Suggested maximum home price
Treat these as guidelines, not permission slips. The goal is clarity, not maximum leverage.
Step 5: Stress-Test The Payment
Rate increases
Run scenarios with slightly higher interest rates to see how sensitive your payment is to market changes, especially if you’re buying before rates stabilize.
Tax and insurance changes
Property taxes and insurance often rise over time. Make sure the payment still works if these costs increase modestly after purchase.
Income disruption scenarios
Finally, ask the uncomfortable question: What happens if income drops temporarily? A home that remains affordable under less-than-perfect conditions is far more sustainable than one that only works when everything goes right.
This process doesn’t just tell you what you can buy, it shows you what you can own confidently in 2026.
Stop guessing. Plug your income and debts into our Home Affordability Calculator and get a realistic home price range you can afford with confidence.
Beyond Ratios: Down Payment, Rates, And Local Prices
DTI ratios provide a solid framework, but they don’t tell the whole story. In 2026, your real affordability is also shaped by how much cash you bring to the table, where you’re buying, and what interest rates are doing at the moment you lock your loan. These factors can quietly raise, or cap, what a home truly costs you each month.
Down Payment Size And PMI Impact
Trade-offs between low-down-payment and larger down payments
Low-down-payment options can make homeownership accessible sooner, especially for first-time buyers. The trade-off is higher monthly payments and less margin for error. Larger down payments reduce the loan amount, lower monthly principal and interest, and provide instant equity, often translating into a more comfortable long-term ownership experience.
Choosing between the two isn’t just about getting in the door; it’s about how the payment feels after you move in.
PMI and monthly cost implications
For many conventional loans, putting down less than 20% triggers private mortgage insurance (PMI). PMI doesn’t build equity, it’s purely a cost of borrowing, and it can add a noticeable amount to your monthly payment. While PMI can often be removed later, it still affects early cash flow and should be included when evaluating true affordability.
Interest Rates And Buying Power
Why small rate changes matter so much
Interest rates have an outsized impact on affordability. A change of even half a percentage point can shift monthly payments significantly over a 30-year loan. Because rates directly affect the interest portion of your payment, small movements can translate into tens of thousands of dollars in additional interest over time.
How rates reshape affordability ceilings
As rates rise, the maximum home price that fits within a safe monthly payment falls. When rates drop, buying power expands, but that doesn’t automatically mean stretching your budget is wise. In both cases, anchoring your decision to a comfortable monthly payment, not the market’s extremes, keeps affordability grounded.
Local Market Conditions And Loan Limits
High-cost areas vs. national averages
Affordability looks very different depending on location. In high-cost markets, buyers often face higher property taxes, insurance costs, and home prices that outpace national averages. These factors compress affordability even when income is strong.
Jumbo loan considerations
When home prices exceed conforming loan limits, buyers move into jumbo loan territory. Jumbo loans typically require higher credit scores, larger down payments, and more cash reserves. Even if the monthly payment seems manageable, these stricter requirements can limit flexibility and raise the bar for what’s realistically affordable.
In short, ratios set the framework, but down payments, rates, and local conditions determine how livable your home payment will actually be in 2026.

Good External Resources For Further Research
If readers want to go deeper, or double-check their own numbers, it helps to point them toward reputable, education-first sources. These sites don’t just spit out figures; they explain why the numbers work the way they do.
Home Affordability Rules And Calculators
Bankrate
Bankrate offers clear explanations of affordability rules like the 28/36 guideline, along with widely used calculators that factor in income, debt, taxes, and insurance. It’s a strong starting point for understanding how lenders and planners frame affordability.
SmartAsset
SmartAsset excels at visualizing affordability. Its tools break down how income, debt, and location interact, making it easier to see how changes in one variable affect the rest of your budget.
Chase
As a major lender, Chase provides practical explanations of mortgage math, DTI ratios, and income guidelines. While it reflects a bank’s perspective, its educational content helps readers understand how lenders think.
Debt-To-Income Education
NerdWallet
NerdWallet is particularly strong at explaining front-end vs. back-end DTI in plain language. It bridges the gap between lender formulas and real-world budgeting concerns.
Investopedia
For readers who want definitions and mechanics without hype, Investopedia offers detailed breakdowns of DTI ratios, mortgage terminology, and how these metrics are calculated.
Official Mortgage And Loan Limit Sources
Fannie Mae
Fannie Mae publishes official underwriting standards and DTI guidance for conforming loans, making it a primary source for how most conventional mortgages are evaluated.
Freddie Mac
Freddie Mac provides complementary guidance on loan standards, affordability considerations, and market trends that influence mortgage availability.
FHFA (Federal Housing Finance Agency)
The FHFA sets and announces conforming loan limits each year. Its publications explain how rising home prices affect borrowing caps nationally and in high-cost areas.
General Financial Education Frameworks
Schwab Moneywise
Schwab Moneywise focuses on affordability as part of a broader financial picture, tying housing decisions to long-term investing, saving, and wealth-building goals.
Other trusted affordability guides
Well-established personal finance platforms and housing education sites can provide useful context, especially when they emphasize conservative planning over maximum leverage.
Final Takeaway: The “Right” Home Price Is Personal

There is no universal number that defines what you should spend on a home in 2026, only a range that makes sense for you.
Why lender approval is not a spending target
Approval limits are risk thresholds, not recommendations. Just because a bank will lend more doesn’t mean your budget, or your peace of mind, should follow.
Choosing sustainability over stretch
Homes that fit comfortably within your cash flow are easier to keep, easier to enjoy, and far less likely to derail other financial goals. Stretching to the edge may feel exciting at purchase, but it often becomes exhausting over time.
Framing affordability as a long-term wealth decision
A truly affordable home supports saving, investing, and flexibility. It allows your net worth to grow instead of trapping it inside a single monthly payment. In the end, the right home price isn’t the highest one you can reach, it’s the one that lets your financial life keep moving forward.

Leave a comment
Your email address will not be published. Required fields are marked *